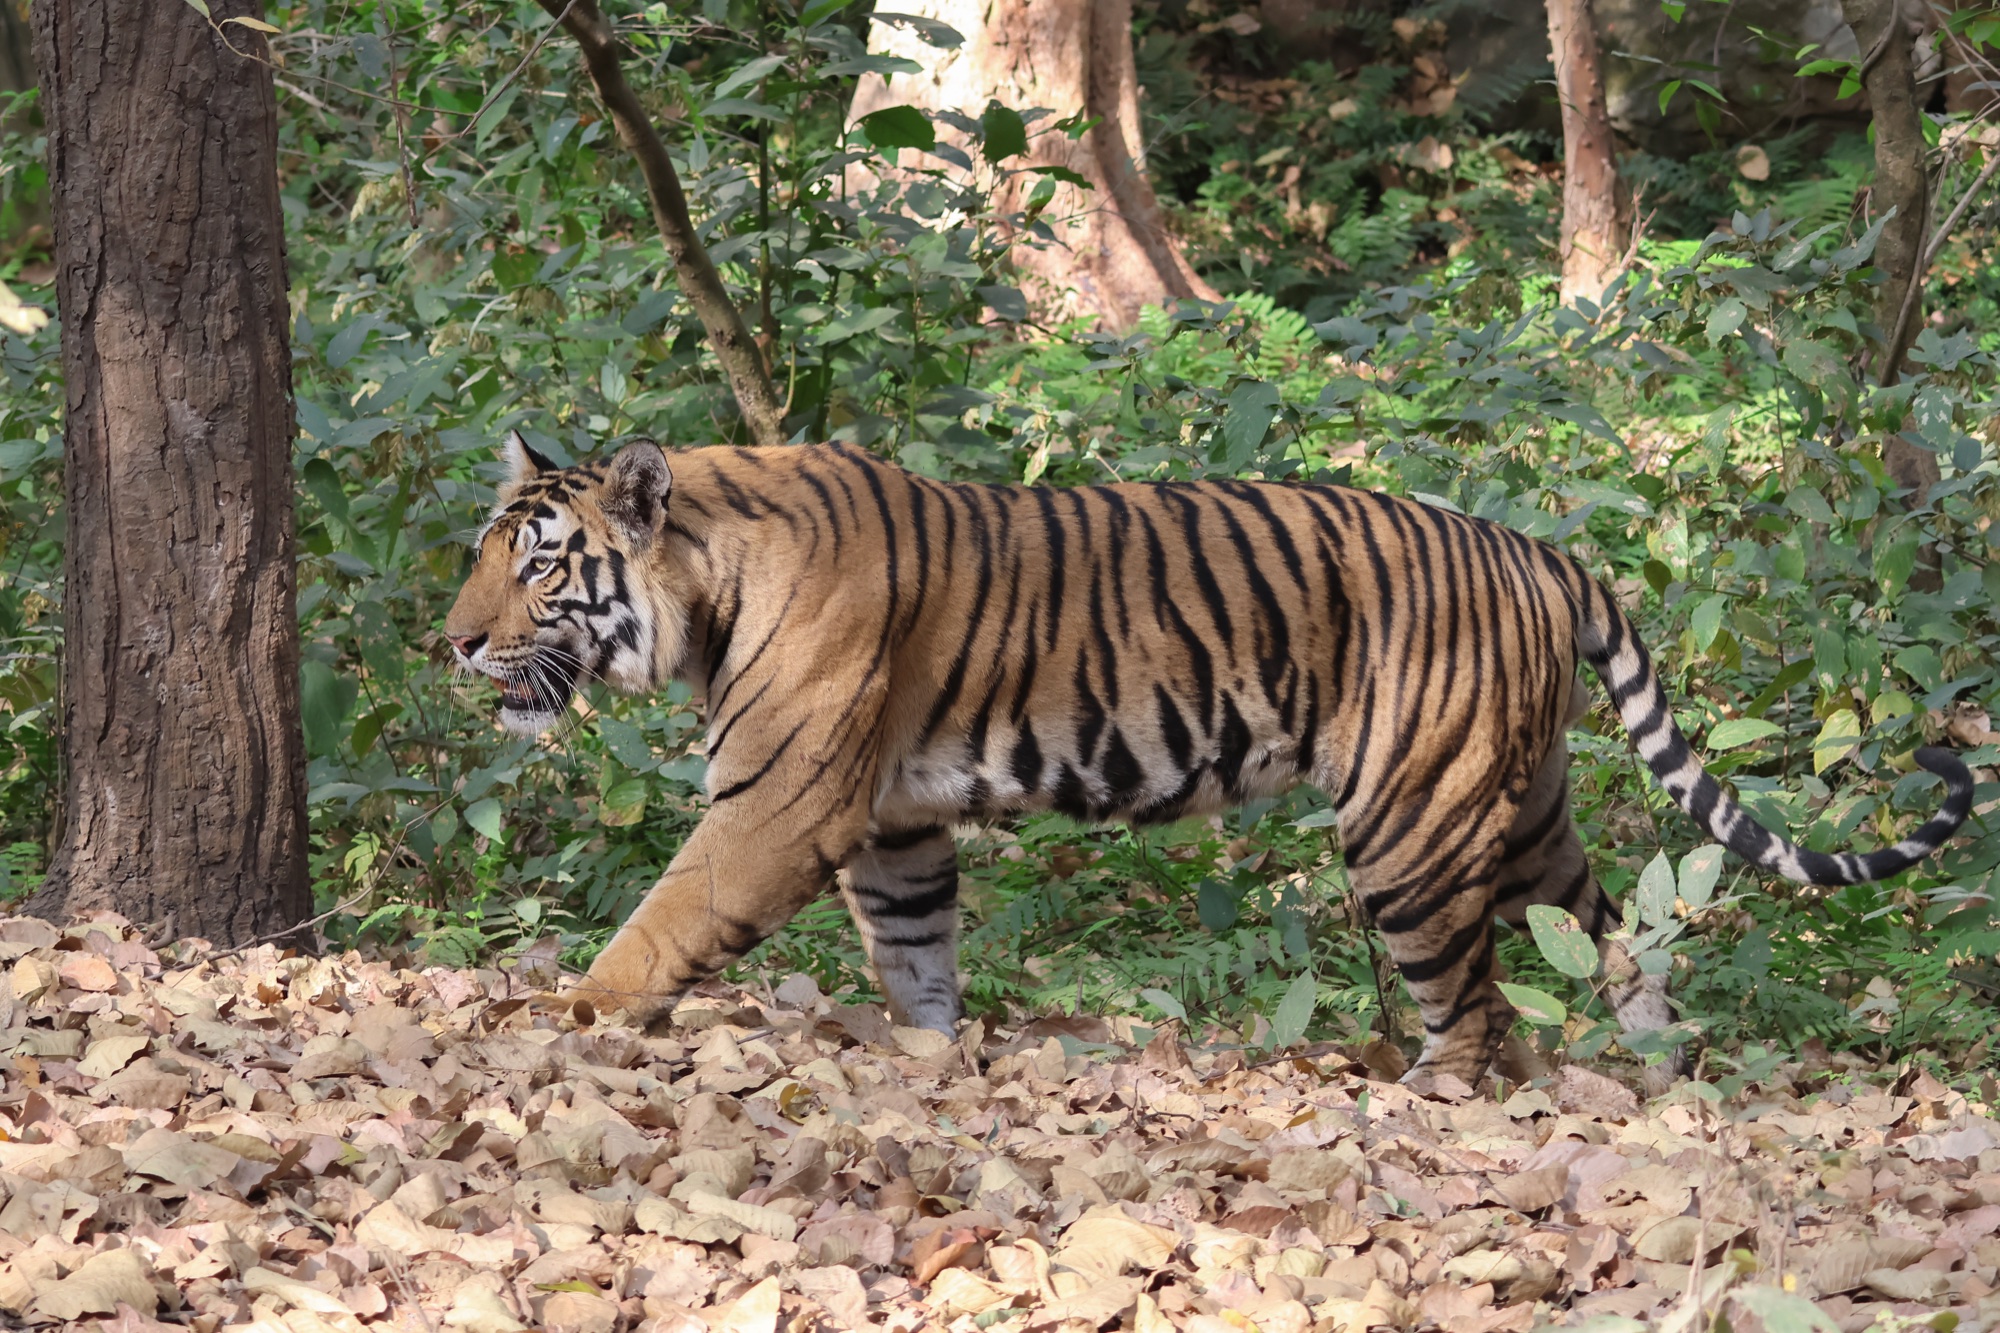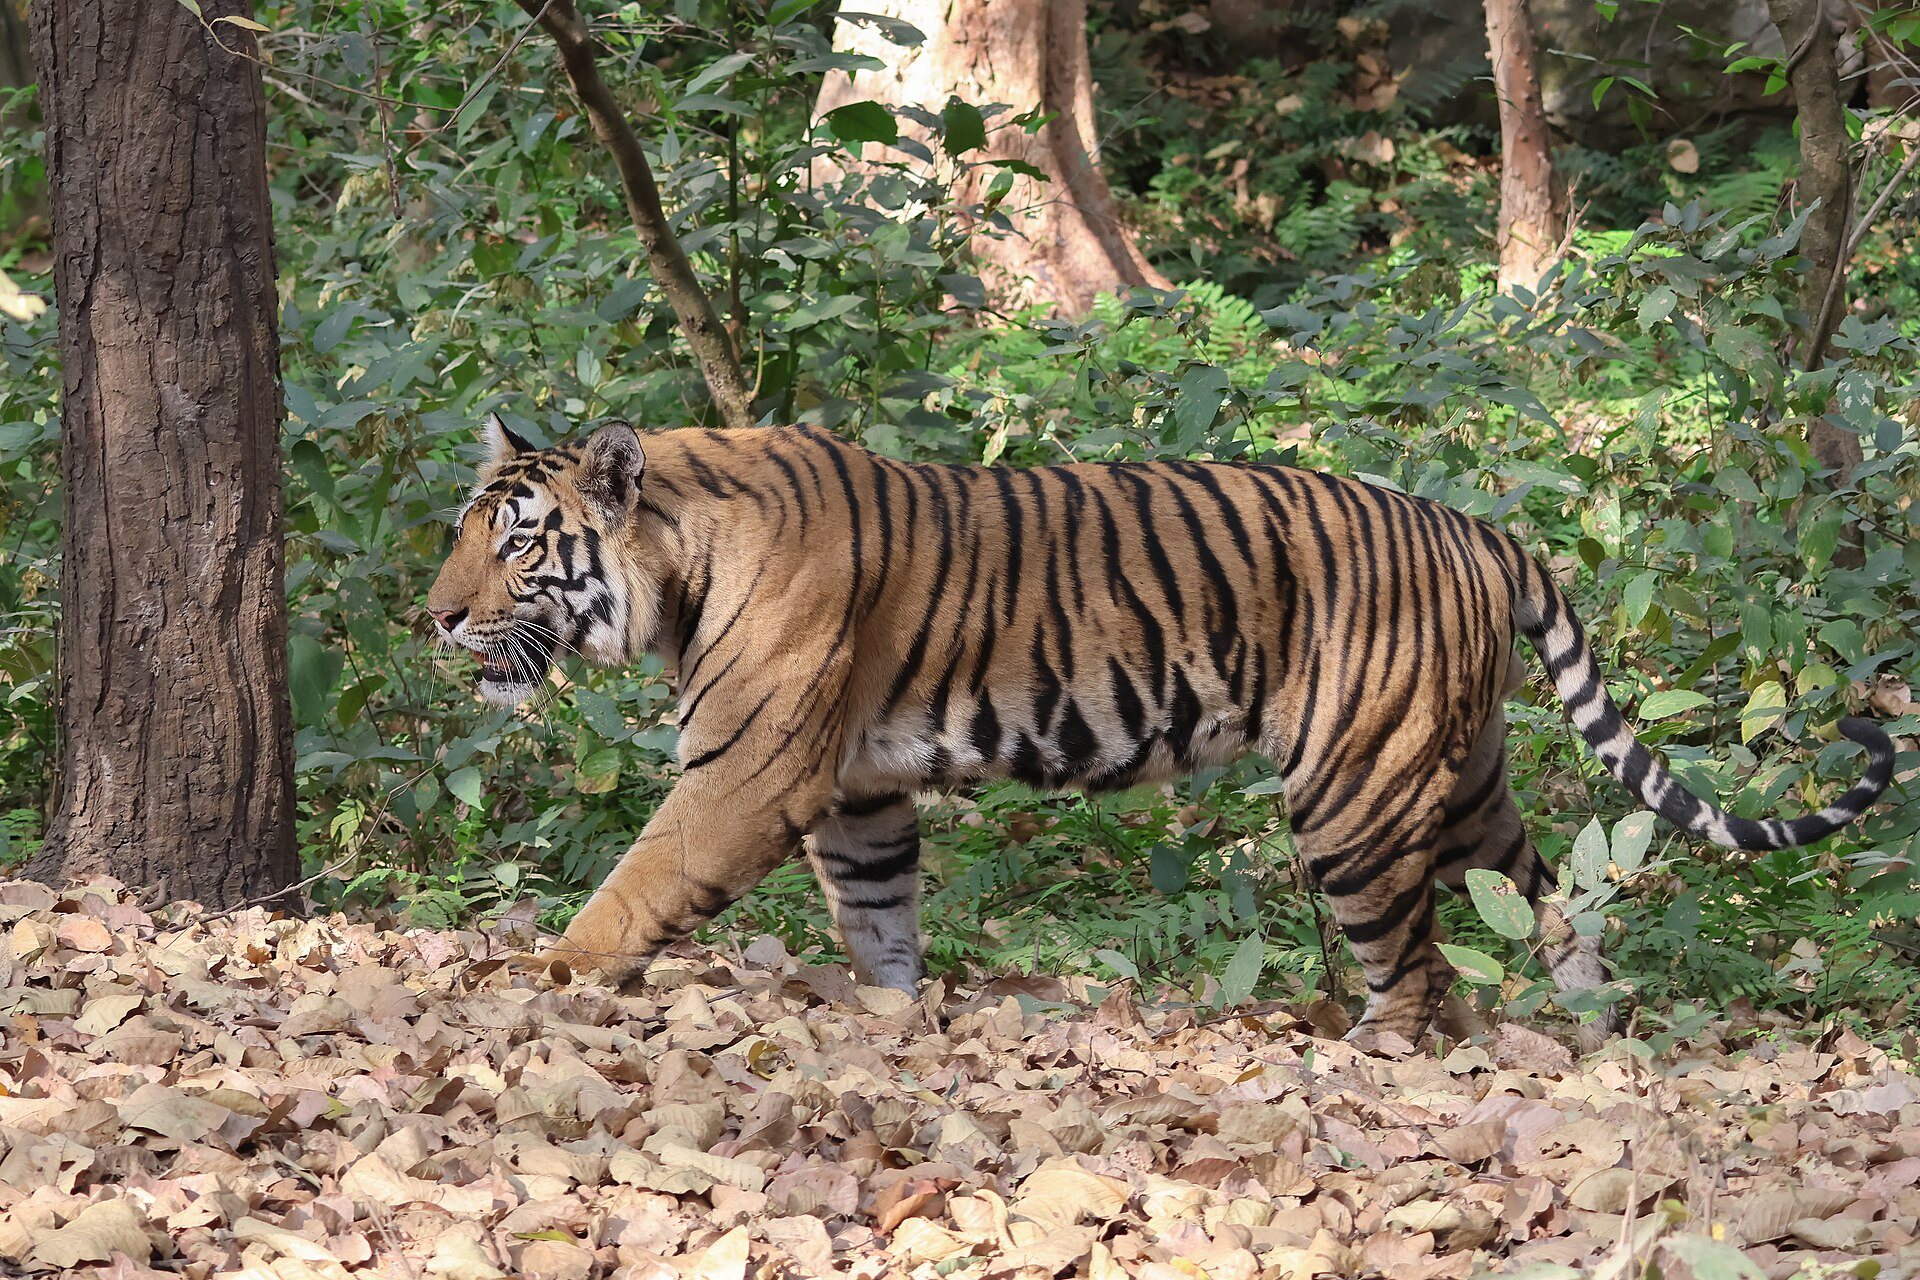
Foto di apertura: A Bengal tiger in Bandhavgarh National Park, by Bernard Gagnon (CC BY 4.0), via Wikimedia Commons
A guest asked us, somewhere between two sightings in Bandhavgarh, how India knows how many tigers it has. It is a better question than it sounds, and the honest answer took most of the drive.
The short version is that the number everyone quotes is not a count. It is an estimate, produced by a survey of extraordinary physical scale followed by a statistical model, and the distance between what was observed and what is published is both perfectly legitimate and the subject of a twenty-year argument among serious scientists.
None of that makes the number untrustworthy. It does mean that reading it as though someone walked round India with a tally counter will mislead you — in both directions, as it happens. So here is how it actually works.
Who runs it, and how often
The exercise is the All India Tiger Estimation, and it runs every four years. Cycles were completed in 2006, 2010, 2014, 2018 and 2022; the sixth cycle formally commenced on 22 August 2025 at a meeting of state nodal officers in Dehradun, with training workshops across five tiger landscapes from September to November that year. Its results are not yet published.
Three bodies do the work. The National Tiger Conservation Authority is the statutory authority — worth noting that it is not a creation of the Wild Life (Protection) Act of 1972 itself, as is often written, but of sections 38L and 38O inserted into that Act by the 2006 amendment. The Wildlife Institute of India, through its Tiger Cell, is the technical engine: it designs the survey and does the analysis. And the state forest departments do the fieldwork, which is to say that the walking is done by forest guards across twenty tiger-bearing states.
That division matters later. When people describe the estimation as a government number, they are describing something assembled from measurements taken by thousands of people who will never see the model that consumes them.
What actually happens in the forest
The survey is conventionally described in four phases, though the field guide the surveyors actually carry is organised by numbered forms rather than phases. Both descriptions are accurate; they are two registers of the same work.
Phase I is the ground survey, on foot. In each beat — the primary forest patrolling unit, and the sampling unit for the whole exercise — staff cover a minimum of fifteen kilometres in three to five separate searches, recording every sign of a carnivore: pugmarks, scat, scrapes, scent marks, rake marks, vocalisations, direct sightings. Separately they walk line transects of two to four kilometres on at least three different mornings to estimate how much prey there is. They sample vegetation at four-hundred-metre intervals in concentric circular plots, fifteen metres' radius for trees, five for shrubs, one for ground cover. And they count ungulate dung in plots two metres by twenty.
In 2022 that added up to a foot survey of 641,449 kilometres and 324,003 habitat plots, at a total effort of over 641,102 man-days. The distance is roughly sixteen times round the Earth at the equator, walked.
Phase II is desk work: satellite data supplying habitat and human-impact variables for the whole landscape, including the large parts of it nobody put a camera in.
Phase III is the camera trapping, and this is the part with the headline numbers. In 2022, camera traps were deployed at 32,588 locations across 174 sites. They ran twenty-five to thirty-five days at each site, on a grid of two square kilometres — 1.415 by 1.415 kilometres — with adjacent stations ideally 0.8 to 2 kilometres apart and at least one pair of cameras in every cell. The whole of a reserve's sampling is meant to be completed inside sixty days. Between them the cameras produced 47,081,881 photographs, of which 97,399 were of tigers: about one frame in 484.
Phase IV is the part most travellers never hear about and most often walk past. Since 2011 the important source populations have been monitored not every four years but every year, at twenty-five double-sided cameras per hundred square kilometres and a minimum of a thousand trap-nights per hundred square kilometres, run by each state's Chief Wildlife Warden. In a major reserve, camera traps are a permanent annual feature of the landscape.
Why the cameras come in pairs
This is the detail that makes the whole thing click, and once you know it you will never look at a camera trap the same way.
A tiger's stripes are individually unique — the standard analogy is a fingerprint, and it holds. But the two flanks carry different patterns. A left flank will not match a database built from right flanks. And a single camera on a trail photographs whichever side faces it, which depends entirely on which direction the tiger happened to walk.
So the cameras are set facing each other across the track. Both flanks are captured in the same instant, and each detection becomes a complete identification that can be matched against every previous capture of every tiger in the country. The manual specifies mounting at knee height — about a foot and a half off the ground — explicitly so that the lens is on the flank rather than the back, and so that cubs and smaller mammals are in frame too.
On a game drive during a trapping window, this is what to look for: not a single box on a tree, but a matched pair on opposite sides of the track at shin height. The facing pair is the visual signature of a tiger survey rather than somebody's casual wildlife camera.
From 47 million photographs to 3,080 tigers
Two different pieces of software do two different jobs here, and the distinction gets muddled in reporting.
The triage is done by machine learning. An artificial-intelligence tool, working with a system called CaTRAT — the Camera Trap Data Repository and Analysis Tool — sorts tens of millions of frames by species, so that the tiger photographs can be separated from the forty-seven million images of leaves moving, langursLangurThe grey, black-faced, long-tailed monkey of the Indian forest and temple town.Read in the glossary, chitalChitalThe spotted deer of the Indian forest — the commonest deer, and the one most often seen.Read in the glossary, elephants and forest guards.
The identification is not done by that tool. Matching tiger to tiger in the 2022 cycle was done by ExtractCompare, a pattern-recognition program that digitises coat patterns and searches the national database for similarity, accounting for the animal's posture in three dimensions. It was used in the 2018 cycle too. India has not switched to an AI identification system, whatever the headlines imply — the AI decides which frames contain a tiger, and ExtractCompare decides which tiger.
The result of all that was 3,080 individual tigers over a year old, photo-captured in 2022, against 2,461 in 2018. Those two numbers are observations. Everything after this point is inference.
How 3,080 becomes 3,682
The statistical method is called spatially explicit capture-recapture, usually abbreviated SECR, and it works in two steps that are worth separating.
The first step is estimating how many tigers were in the camera-trapped blocks, including the ones the cameras missed. The information that makes this possible is the pattern of recaptures across space. If a given tiger turns up at many stations, the cameras are detecting animals readily and few are slipping through; if most individuals appear once, at one station, detection is poor and a great many tigers went unphotographed. SECR's particular advance is that it models each animal as having a home-range centre somewhere on the landscape, with a probability of detection that falls off with distance from it. That solves an old and genuine problem — nobody ever really knew what area a camera grid sampled — because the effective sampled area now falls out of the model instead of being guessed. The output is a density, with a confidence interval that reflects how tightly the data actually pin the answer down.
The second step is the one to understand properly. Camera traps cover only part of the tiger's range in India. For tiger-occupied country that was never camera-trapped, the model predicts density from the variables measured everywhere — sign encounter rates, prey abundance, dung density, human footprint — calibrated against the densities SECR measured where the cameras were. Fitting the calibration and the density estimation together rather than in sequence is what the reports mean by a joint likelihood framework.
This approach is called double sampling, and its appeal is economic as much as scientific. The Wildlife Institute's own foundational paper on it reports that the cheap sign-based index cost seven per cent of the camera method financially and thirty-four per cent of it in time. That is what buys national coverage across roughly four hundred thousand square kilometres rather than coverage of the reserves alone.
And it is where the two numbers come from. 3,167 is, in the report's own word, the minimum — the population estimate from the camera-trapped area. 3,682 is the national average figure once the model extrapolates to everywhere else, with an upper limit of 3,925. Roughly six hundred of India's tigers have therefore never had their photograph taken and exist in the published total as a modelled inference.
There is nothing improper about that. It is a stated, documented step in a published method. But it is the step the critics attack, and it is worth knowing it is there.
The April and July of 2023
The sequencing of the last release is instructive, and it is routinely misreported as a correction. It was not one.
On 9 April 2023, at the commemoration of fifty years of Project Tiger in Mysuru, the Prime Minister released the summary report and declared the tiger numbers. The figure was 3,167.
On 29 July 2023, Global Tiger Day, the detailed report followed. Its figure was 3,682, in a range of 3,167 to 3,925, after what the release describes as further analysis by the Wildlife Institute of India of both camera-trapped and non-camera-trapped areas.
Nothing was withdrawn and nothing was corrected. The two announcements reported two different quantities: the camera-trapped estimate, and the modelled national estimate for which the first became the lower bound. But the published headline rose by 515 tigers in sixteen weeks without a single additional photograph — and the conservative number was announced from a commemorative stage while the number that extrapolation produced came out, in a technical release, three and a half months later.
This two-step is the standing pattern rather than anything unusual; the 2018 detailed report was likewise released separately, on the eve of Global Tiger Day 2020. We set it out because it is the clearest illustration available of what the method does and does not observe.
The argument, fairly put
The methodology has been contested in the peer-reviewed literature for over twenty years, and the shape of the argument is not what a reader expects. It is not a case of scientists doubting that India has tigers. It is that the critics won the first round outright, and the second round is about the method that replaced the one they demolished.
In 2003, Ullas Karanth and eight co-authors published a paper in Animal Conservation attacking the pugmark census that had been used for three decades. Their charges were specific: the method assumed tigers hold non-overlapping ranges when in fact a male's range overlaps those of several females; it required five separate assumptions to hold perfectly, so that substrate problems caused overcounting and incomplete coverage caused undercounting and the relation between the count and the truth was simply unpredictable; and after thirty years no national distribution maps existed, because effort had never been recorded or geo-referenced.
They were vindicated. The pugmark census was abandoned. A new methodology was approved by the Tiger Task Force in 2005 and first applied in 2006 — and this is the honest explanation of the apparent crash in that year. The 1,411 figure of 2006 was so much lower than the pugmark-era claims because the method had changed, not because the tigers had vanished in a single season.
The second round began when the same group turned on the replacement. In 2015, Arjun Gopalaswamy, Karanth and colleagues published a paper in Methods in Ecology and Evolution examining index-calibration experiments of the kind double sampling relies on. Their argument was statistical: the goodness-of-fit statistic such calibrations lean on can rise for reasons that have nothing to do with the index tracking abundance, so a reassuring correlation can be an artefact of the sampling regime. Tested against two tiger sign-calibration experiments, performance was poor in one and anomalously high in the other. They recommended joint likelihood models with appropriate survey designs instead. Karanth's own summary, in the university's press release, was that the study exposed fundamental statistical weaknesses in the sampling, calibration and extrapolation at the core of the government's method.
The Wildlife Institute side answered in print, in PeerJ in 2019, defending the approach and disputing the critics' treatment of the data. Neither paper has been retracted or corrected. Both remain in the literature, and that is where the argument sits.
One observation we will make carefully, because it is an observation about two documents rather than a claim about anyone's intentions. The 2015 critique recommended joint likelihood models. The 2022 report describes using its covariates within SECR in a joint likelihood framework. On the face of it the current cycle uses the class of model the critics asked for. We could find no source in which the authority says the change was made in response to the criticism, and none in which the critics accept that it answers them.
Meanwhile the dataset itself has passed review at the highest level: in 2025, Science published an analysis by the Wildlife Institute team built on this survey, reporting that tiger occupancy had increased by thirty per cent over two decades to roughly 138,200 square kilometres, and that tigers had colonised habitat shared with some sixty million people. That establishes that the data were found publishable. It does not establish that the extrapolation dispute is settled.
What the number does not tell you
India holds more than seventy per cent of the world's wild tigers, across fifty-eight tiger reserves in eighteen states. The most recent official figure, as of this writing, is still the 3,682 of the 2022 cycle.
The thing a traveller should take from this is not scepticism about the total. It is that a national average conceals a very uneven distribution. The Science paper is blunt about the other end of it: tiger absence and extinction, it reports, were characterised by armed conflict, poverty and extensive land-use change. A handful of reserves hold hundreds of animals; a number hold very few, and the published reports acknowledge as much.
So a rising national number and emptying individual reserves are not contradictory claims. They are the same finding seen at two scales. Anyone who reads 3,682 and rising as meaning tigers are doing well everywhere has been misled by an average rather than by a lie.
We have deliberately not listed which reserves are at the bottom of that distribution. The reserve-by-reserve tables are published, but we could not open the primary document to read them ourselves, and we are not willing to repeat reserve names from secondary summaries as though we had checked them.
What this changes on a game drive
Three things, all of them small and all of them worth knowing.
The pair of boxes at shin height is a national survey in progress. Cameras go where tigers walk, which in practice means the same forest roads and dry stream beds the vehicles use, so during a trapping window you will pass them.
The guard entering a sighting on his phone is not doing paperwork. Since 2011 the field data have run through M-STrIPES — the Monitoring System for Tigers: Intensive Protection and Ecological Status — an Android application with GPS tracking that records patrol routes, wildlife observations and ecological data in real time. Whatever one concludes about the extrapolation, this is the direct answer to the 2003 complaint that field effort was never recorded or geo-referenced. Every transect is now a GPS track with a timestamp, and the effort is auditable in a way it was not before.
And the famous tigress you have travelled to see is the same animal the state counts. Because identification is by stripe pattern against a national repository of camera-trap photographs, the named individuals of Ranthambhore and Bandhavgarh have files. Your photograph and the surveyor's photograph are the same kind of evidence, differing only in intent.
We have not been able to establish whether any reserve offers guests an organised look at the monitoring work — a camera-trap check, time with the Phase IV team, a visit to a monitoring room. If that interests you, ask us and we will make the enquiry with the specific reserve rather than guess.
A note on our figures
Every number in this piece comes from the authority's own published reports, the Wildlife Institute, Press Information Bureau releases, parliamentary answers or the named journal papers. Where official sources disagree we have said so or chosen the conservative figure.
Two such disagreements are worth flagging. The authority's own list of frequently asked questions gives the 2022 estimate as 3,652 rather than 3,682, with an identical range — almost certainly a typo, since 3,682 appears in three separate Press Information Bureau releases. And India's share of the world's wild tigers has been officially described as almost seventy-five per cent in July 2023, more than seventy per cent in 2024, and nearly seventy per cent in July 2026, with no explanation for the drift in any release we read. We have used more than seventy per cent, which the 2022 report itself states.
I viaggi che la portano lì
Da leggere dopo